S&P 500 Breadth Indicators
Number of Stocks Above the 21 Day MAs (4-Year Chart)
Number of Stocks Above the 21 Day MAs (1-Year Chart)
5 Most Recent 21 Day MA Breadth Counts
| Date | Num Stocks Above 21 Day MA |
|---|---|
| 06/18/2026 | 262 |
| 06/17/2026 | 263 |
| 06/16/2026 | 342 |
| 06/15/2026 | 352 |
| 06/12/2026 | 358 |
Number of 20 Day Breakouts
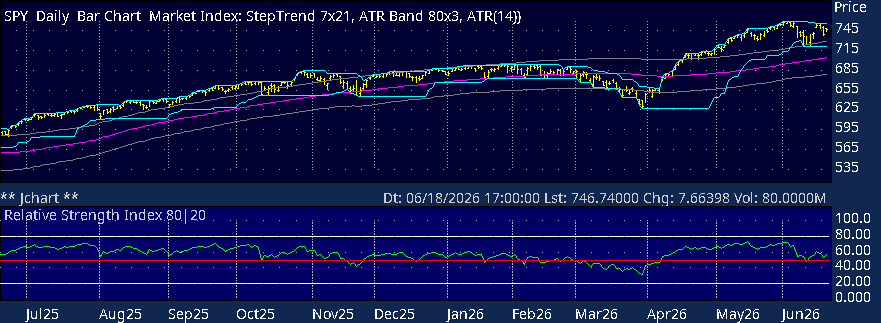
S&P 500 Step Trend, ATR Bands, RSI
Copyright © www.jchart.com 2026.